 Value of Citizen Science Data and Limited Other Information for Hydrological Model Calibration
My name is Franziska and I worked as a community manager in the CrowdWater project between December 2019 and January 2023. I also wrote my master’s thesis as part of CrowdWater and submitted it in June 2022. What I did and what came out of it, I present on this page. I make my whole thesis available as a PDF here.
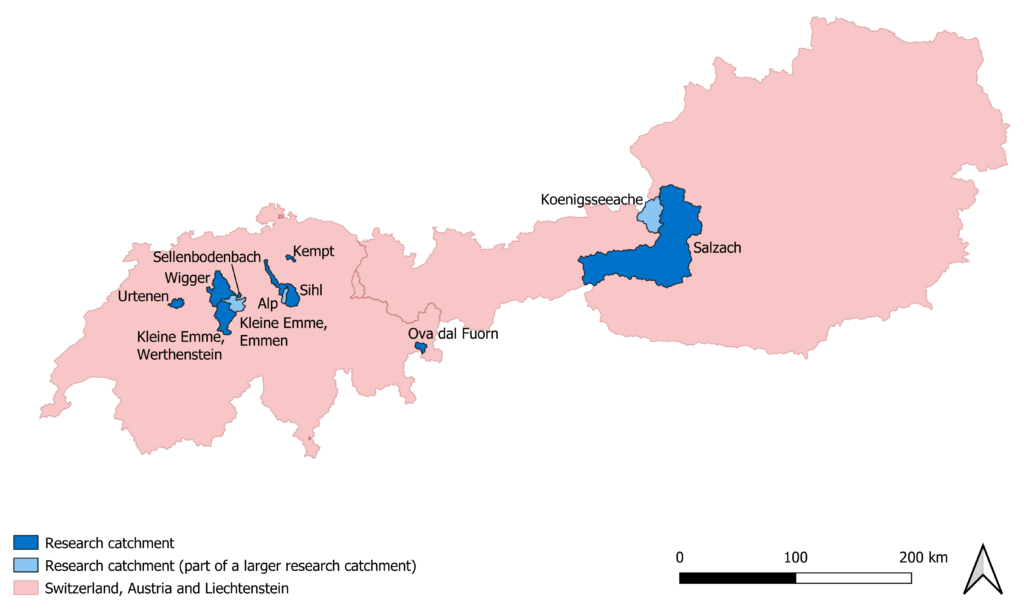
For my Master’s thesis I did hydrological modelling. In doing so, I used observations of the water level class in the “virtual staff gauge” category from eleven catchments in Switzerland and Austria. The eleven catchments are shown on the map below. From all these catchments officially measured discharge data are available, which I could use to check my results. The aim of my work was to find out more about the value of the observations for hydrological modelling. I used the citizen science data in combination with other information about discharge.
For each catchment I had a certain number of water level class observations available. I combined these with a limited number of discharge measurements, which are regularly distributed throughout the year. In this way I obtained 24 different scenarios of data availability, namely all possible combinations of
- 0%, 25%, 50%, 75% and 100% of the available citizen science data, and
- 0, 1, 3, 6, 12 streamflow measurements per year.
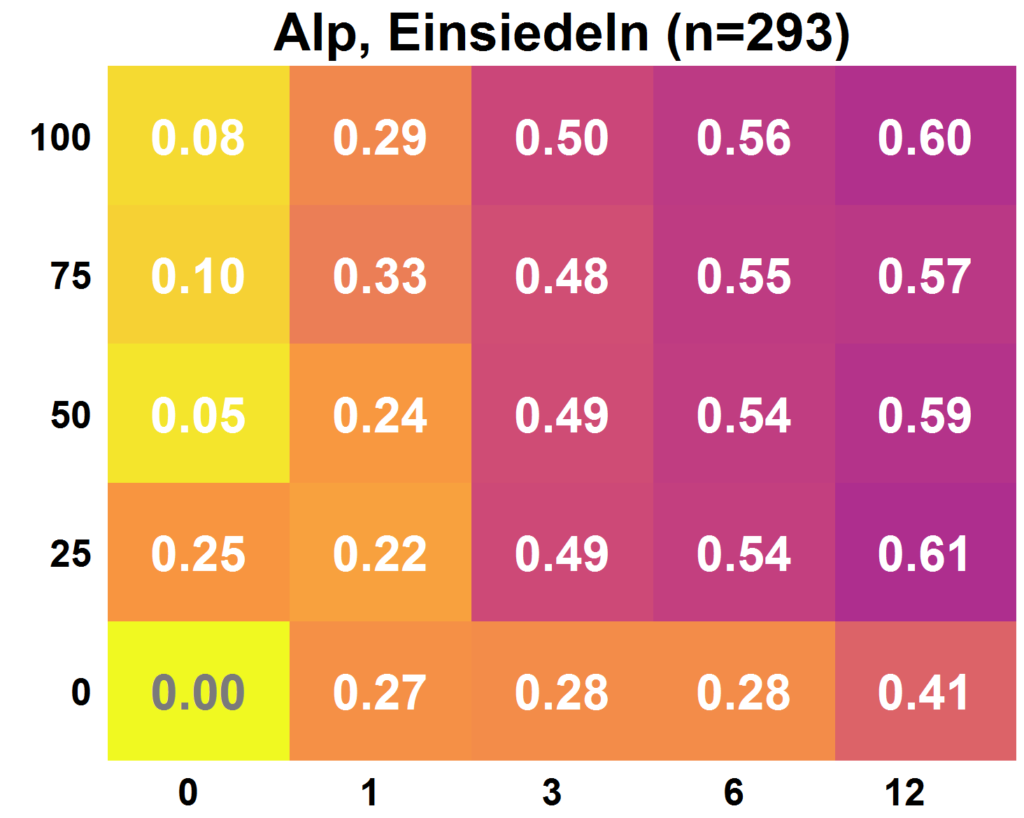
These 24 scenarios formed the basic approach for the analyses of the value of the data: I calibrated the HBV model (a model for simulating discharge in a catchment) for each of my catchments with the 24 different scenarios. This gave me parameter sets with which I could simulate the discharge in a catchment. I compared this simulated hydrograph (time series of the simulated discharge) with the hydrograph measured at the respective measuring point. This comparison allowed a statement about how well the model can simulate the actual discharge. This model quality can be expressed with a number. The higher this number, the better the agreement between the simulated and the measured discharge.
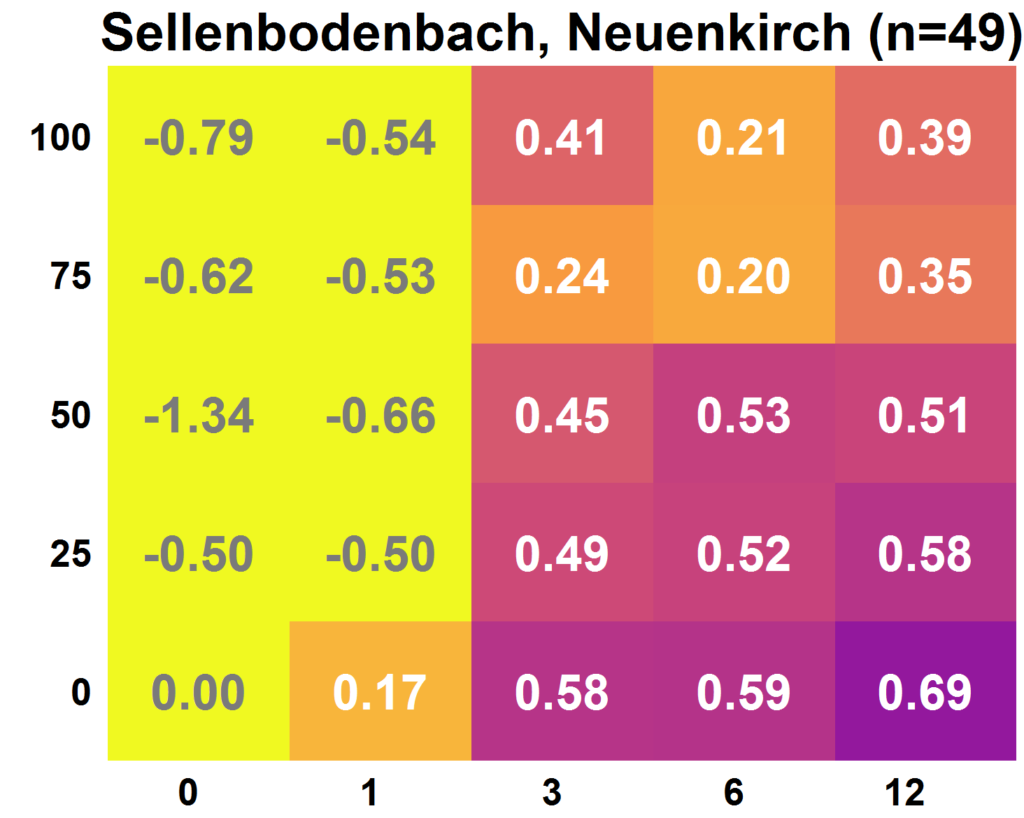
The graph below on the left shows an example of the results for the Alp in Einsiedeln. It is clearly visible that the model quality tends to be higher with more data: the fields become darker (which corresponds to a higher value) the higher and the further to the right the field is located. The number of discharge measurements increases from left to right. The proportion of citizen science observations used increases from bottom to top. Randomly selected parameter sets result in a model quality of 0, a perfect simulation of the discharge results in a model quality of 1. The results were not so clear for all catchments. The amount of citizen science observations available and their accuracy had an influence on whether the use of citizen science observations led to added value or not. For example, in the Sellenbodenbach in Neuenkirch, calibrations based on 12 discharge measurements were more successful than when additional citizen science observations were used.
I modified the basic approach described above in several ways to obtain more information about the value of different data. The additional use of an estimate for the mean discharge in the catchment led to a significant improvement of the results. In catchments with rather inaccurate observations of water level classes, a further improvement of the results could be achieved by using the measured water levels at the same points in time instead of water level classes.
In a final approach, I used the resulting median values from the CrowdWater game instead of the water level classes from the app for the Koenigsseeache, the Salzach, the Urtene and the Alp. For the Alp, where the water level classes were improved in the game (for the Koenigsseeache and the Salzach there was no clear improvement, for the Urtene the values from the app were better than those from the game), the results were thus improved, especially when the calibration was mainly based on citizen science data.
I thank everyone for contributing to the CrowdWater project and making my thesis possible. I loved working with the app and game data! If you have questions or comments regarding my thesis, don’t hesitate to send me an e-mail at info@crowdwater.ch.